

Magnification Shape Styling in Lens Insets in Julia
Here is a scatter plot of the recurrence relation
\[ \begin{eqnarray*} x_{i+1} &= &1 - y + a|x_i|\\ y_{i+1} &= &x_i \end{eqnarray*} \]
This is a variation of the recurrence relation sometimes called the “gingerbread man”, modified with the parameter \(a\). It creates a variety of patterns that depend in an unpredictable way on the parameter.
Here’s what 10,000 iterations of the map looks like, using \(a = 1.4\) and initial values for \(x\) and \(y\) of 4:
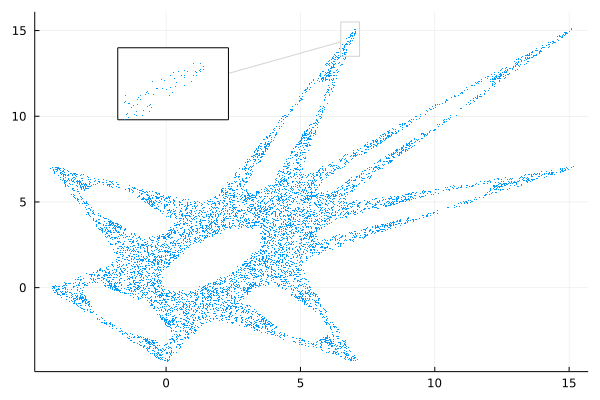
I calculated and plotted this in Julia using the Plots package. The magnification inset plot is created with a call to lens!(). This is a really convenient function: you just pass it the coordinates of the rectangle that you want to magnify, a bounding box telling it where to put the inset, and it does the rest.
I had one problem with it, though. You can style the inset plot itself just like any plot, but you couldn’t style the lines that form the “magnification shape”: the rectangle that points out the part that’s being magnified and the line connecting from that to the inset. That light gray color was hard-coded, and I don’t think it’s easy to see.
But as of October 5th, 2021, if you update your Plots package, you’ll get v.1.22.4, and you can style those lines. Just pass attributes for linewidth, linestyle, and linecolor to the lens!() call. Here’s the same plot, using
    lens!([6.5, 7.2], [13.5, 15.5];
          inset=(1, bbox(0.15, 0.1, 0.2, 0.2)),
          subplot=2, ticks=false, framestyle=:box,
          lw=2, ls=:dot, lc=:orange)

If you don’t supply the line styles, you get the previous default.
I made a pull request for this change just a few days before (a request that my changes to the code be incorporated into the library). That you were able to use it so soon is a testament to the excellent stewardship of this package and the dedication of its maintainers, and an example of the cooperative community around Julia projects in general. In an article in LWN I described how convenient Julia’s superb package manager makes it to hack on public packages like Plots.
My Julia book has a chapter about the Plots package, including a detailed section on how to use lens!(), using the gingerbread map as an example.