Simple Fence Plots in gnuplot
In this note I will illustrate a quick and dirty way to construct a “fence plot” from a collection of 2d datasets. A more sophisticated approach to fence plots, with somewhat nicer output, can be found here. I offer this example as a very simple, easily understood, and easily modified alternative technique.
Plotting Functions
Here is a little gnuplot script that plots three curves in the form of a fence plot:
<li>unset key</li>
<li>set view 54, 111</li>
<li>set xrange [0 : pi]</li>
<li>set yrange [0 : pi]</li>
<li>set zrange [0 : 1]</li>
<li>set iso 200</li>
<li>set samp 200</li>
<li>yf(y, a) = (abs(y-a)<.02) ? 1. : NaN</li>
<li>set style function impulses</li>
<li>splot yf(y,1)*sin(x)**2 lw 2, yf(y,2)*sin(x+1)**2 lw 2, yf(y,3)*sin(x+2)**2 lw 2</li>The graph that this creates is reproduced below. The three segments are the three sin2 functions plotted in the last line of the script, offset from each other by an arbitrary amount, in the usual manner of this kind of plot.
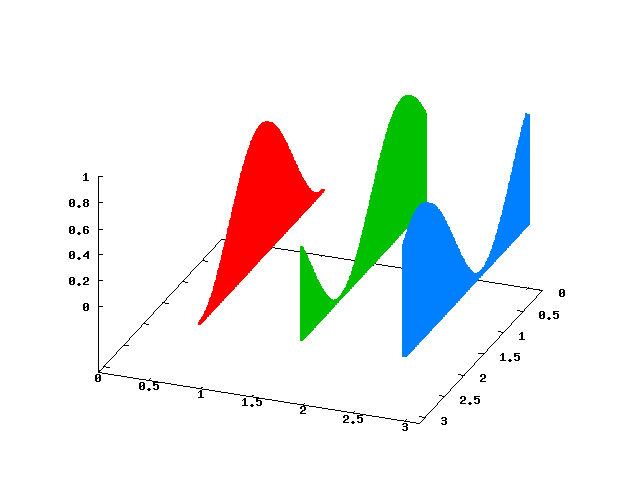
The function yf defined in the script, using gnuplot’s convenient ternary notation, is a trick to “blank out” the part of the surface that is not near the line y = a, leaving us with something that will look like a 2d curve. Then using a combination of impulses and a thick linewidth fills in the curves, forming the fences. If you prefer more of a picket fence look, you can decrease the linewidth or the sample frequency.
Plotting from Files
Let’s say you have a collection of files containing 2d data, rather than a set of functions to plot. If they are named in some rational way using filenames with an embedded number, you can use one of gnuplot’s simple looping constructs to read the files and make the fence plot. This script will produce a plot similar to the one above, if your data is stored in files called “file0”, “file1”, etc.:
<li>unset key</li>
<li>set view 54, 111</li>
<li>set xrange [0 : pi]</li>
<li>set yrange [0 : pi]</li>
<li>set zrange [0 : 1]</li>
<li>set style data impulses</li>
<li>splot for [n = 0 : 2] "file".n using 1:(n):2 lw 3</li>
I ran my scripts under gnuplot 4.4.3; earlier versions might not work; the looping syntax, for example, is fairly recent.