What It Is
I’ve put together a simple robot for Google Wave that looks in your new blip for a string formatted a certain way and replaces that string with a sparkline1 .
You input your sparkline like this: [sl[0,-2,1.e-2,2.7]]; in other words, a series of comma-separated numbers prepended by “[sl[” and ended by “]]”. The numbers can be ≥ or < 0; integers; floats; and can use exponential notation. The robot replaces your input by a continuous-line sparkline with the minimum and maximum value indicated by blue and red dots.
The input syntax is verbose because I plan to include other types of graphs later, and “sl” will be one of a number of mnemonics for different types of data representations, I hope.
The robot is quite simple-minded. It only converts the first sparkline it finds; it can’t deal with malformed input; it gets the sparkline from a web service, and if it doesn’t get it fast enough (for Google) it quietly fails; it only works on new blips; it doesn’t remember the original data.
Here is the source for the robot and the source for the web service that actually creates the sparklines. The latter borrows heavily from Joe Gregorio’s work2 . My web service uses the django framework3 , but not much of it. I had to separate out the sparkline creation into a service because it uses the PIL4 , which I discovered could not be imported into the robot. Plotzie inserts an image “directly,” using a data URI (also explained here2 ).
To Do
As mentioned, expand the robot to make different types of sparklines and other kinds of plots or data representations. Other robots that do related things are Graphy (graph-wave@appspot.com), that parses your input to draw a network graph, and a different Graphy (graphy-wave@appspot.com), that uses the Google Graph API to draw very simple plots.
The robot should be made more robust, able to handle slow or bad responses from the web service; it should correct bad input or notify the user.
Plotzie should retain the input numbers in some form: I’m thinking it should create a sub-blip as a comment on the graph that will hold the input. Actually, the alt text of the image is set to the original data, but that is not readily available to the reader (in Firefox the contextual menu on the image lets you see the alt text, but not in a very convenient format).
I hope you enjpy playing with plotzie! Feel free to work on it, release your own versions, or give me back changes to incorporate. I wrote this just to try out the robot API and learn how to deploy robots, but I have no objections to it becoming something useful. The code is in the public domain.
Example of Use
Here is one that happens to use a lot of numbers. If you make a new blip that says:
A sinewave looks like [sl[0.0, 0.063, 0.126, 0.189, 0.251, 0.312, 0.371, 0.429, 0.486, 0.540, 0.592, 0.642, 0.690, 0.734, 0.776, 0.814, 0.849, 0.881, 0.909, 0.934, 0.954, 0.971, 0.984, 0.993, 0.998, 0.999, 0.996, 0.989, 0.978, 0.963, 0.945, 0.922, 0.895, 0.866, 0.832, 0.795, 0.755, 0.712, 0.666, 0.618, 0.567, 0.513, 0.458, 0.400, 0.342, 0.281, 0.220, 0.158, 0.095, 0.031, -0.031, -0.095, -0.158, -0.220, -0.281, -0.342, -0.400, -0.458, -0.513, -0.567, -0.618, -0.666, -0.712, -0.755, -0.795, -0.832, -0.866, -0.895, -0.922, -0.945, -0.963, -0.978, -0.989, -0.996, -0.999, -0.998, -0.993, -0.984, -0.971, -0.954, -0.934, -0.909, -0.881, -0.849, -0.814, -0.776, -0.734, -0.690, -0.642, -0.592, -0.540, -0.486, -0.429, -0.371, -0.312, -0.251, -0.189, -0.126, -0.063, 6.432e-16]].
it will be replaced by:
A sinewave looks like 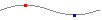 .
.
References
[1] Ask E.T.: Sparklines: theory and practice : http://www.edwardtufte.com/bboard/q-and-a-fetch-msg?msg_id=0001OR&topic_id=1
[2] http://bitworking.org/news/Sparklines_in_data_URIs_in_Python